Overview
The Centre for Dynamic Imaging provides access to a wide range of data visualisation and analysis tools, and offers training and computational power to researchers.
Higher level expertise for more complex data analysis projects is provided by two dedicated bioimage analysts who have more than 30 years of combined experience in image processing and quantification.
-
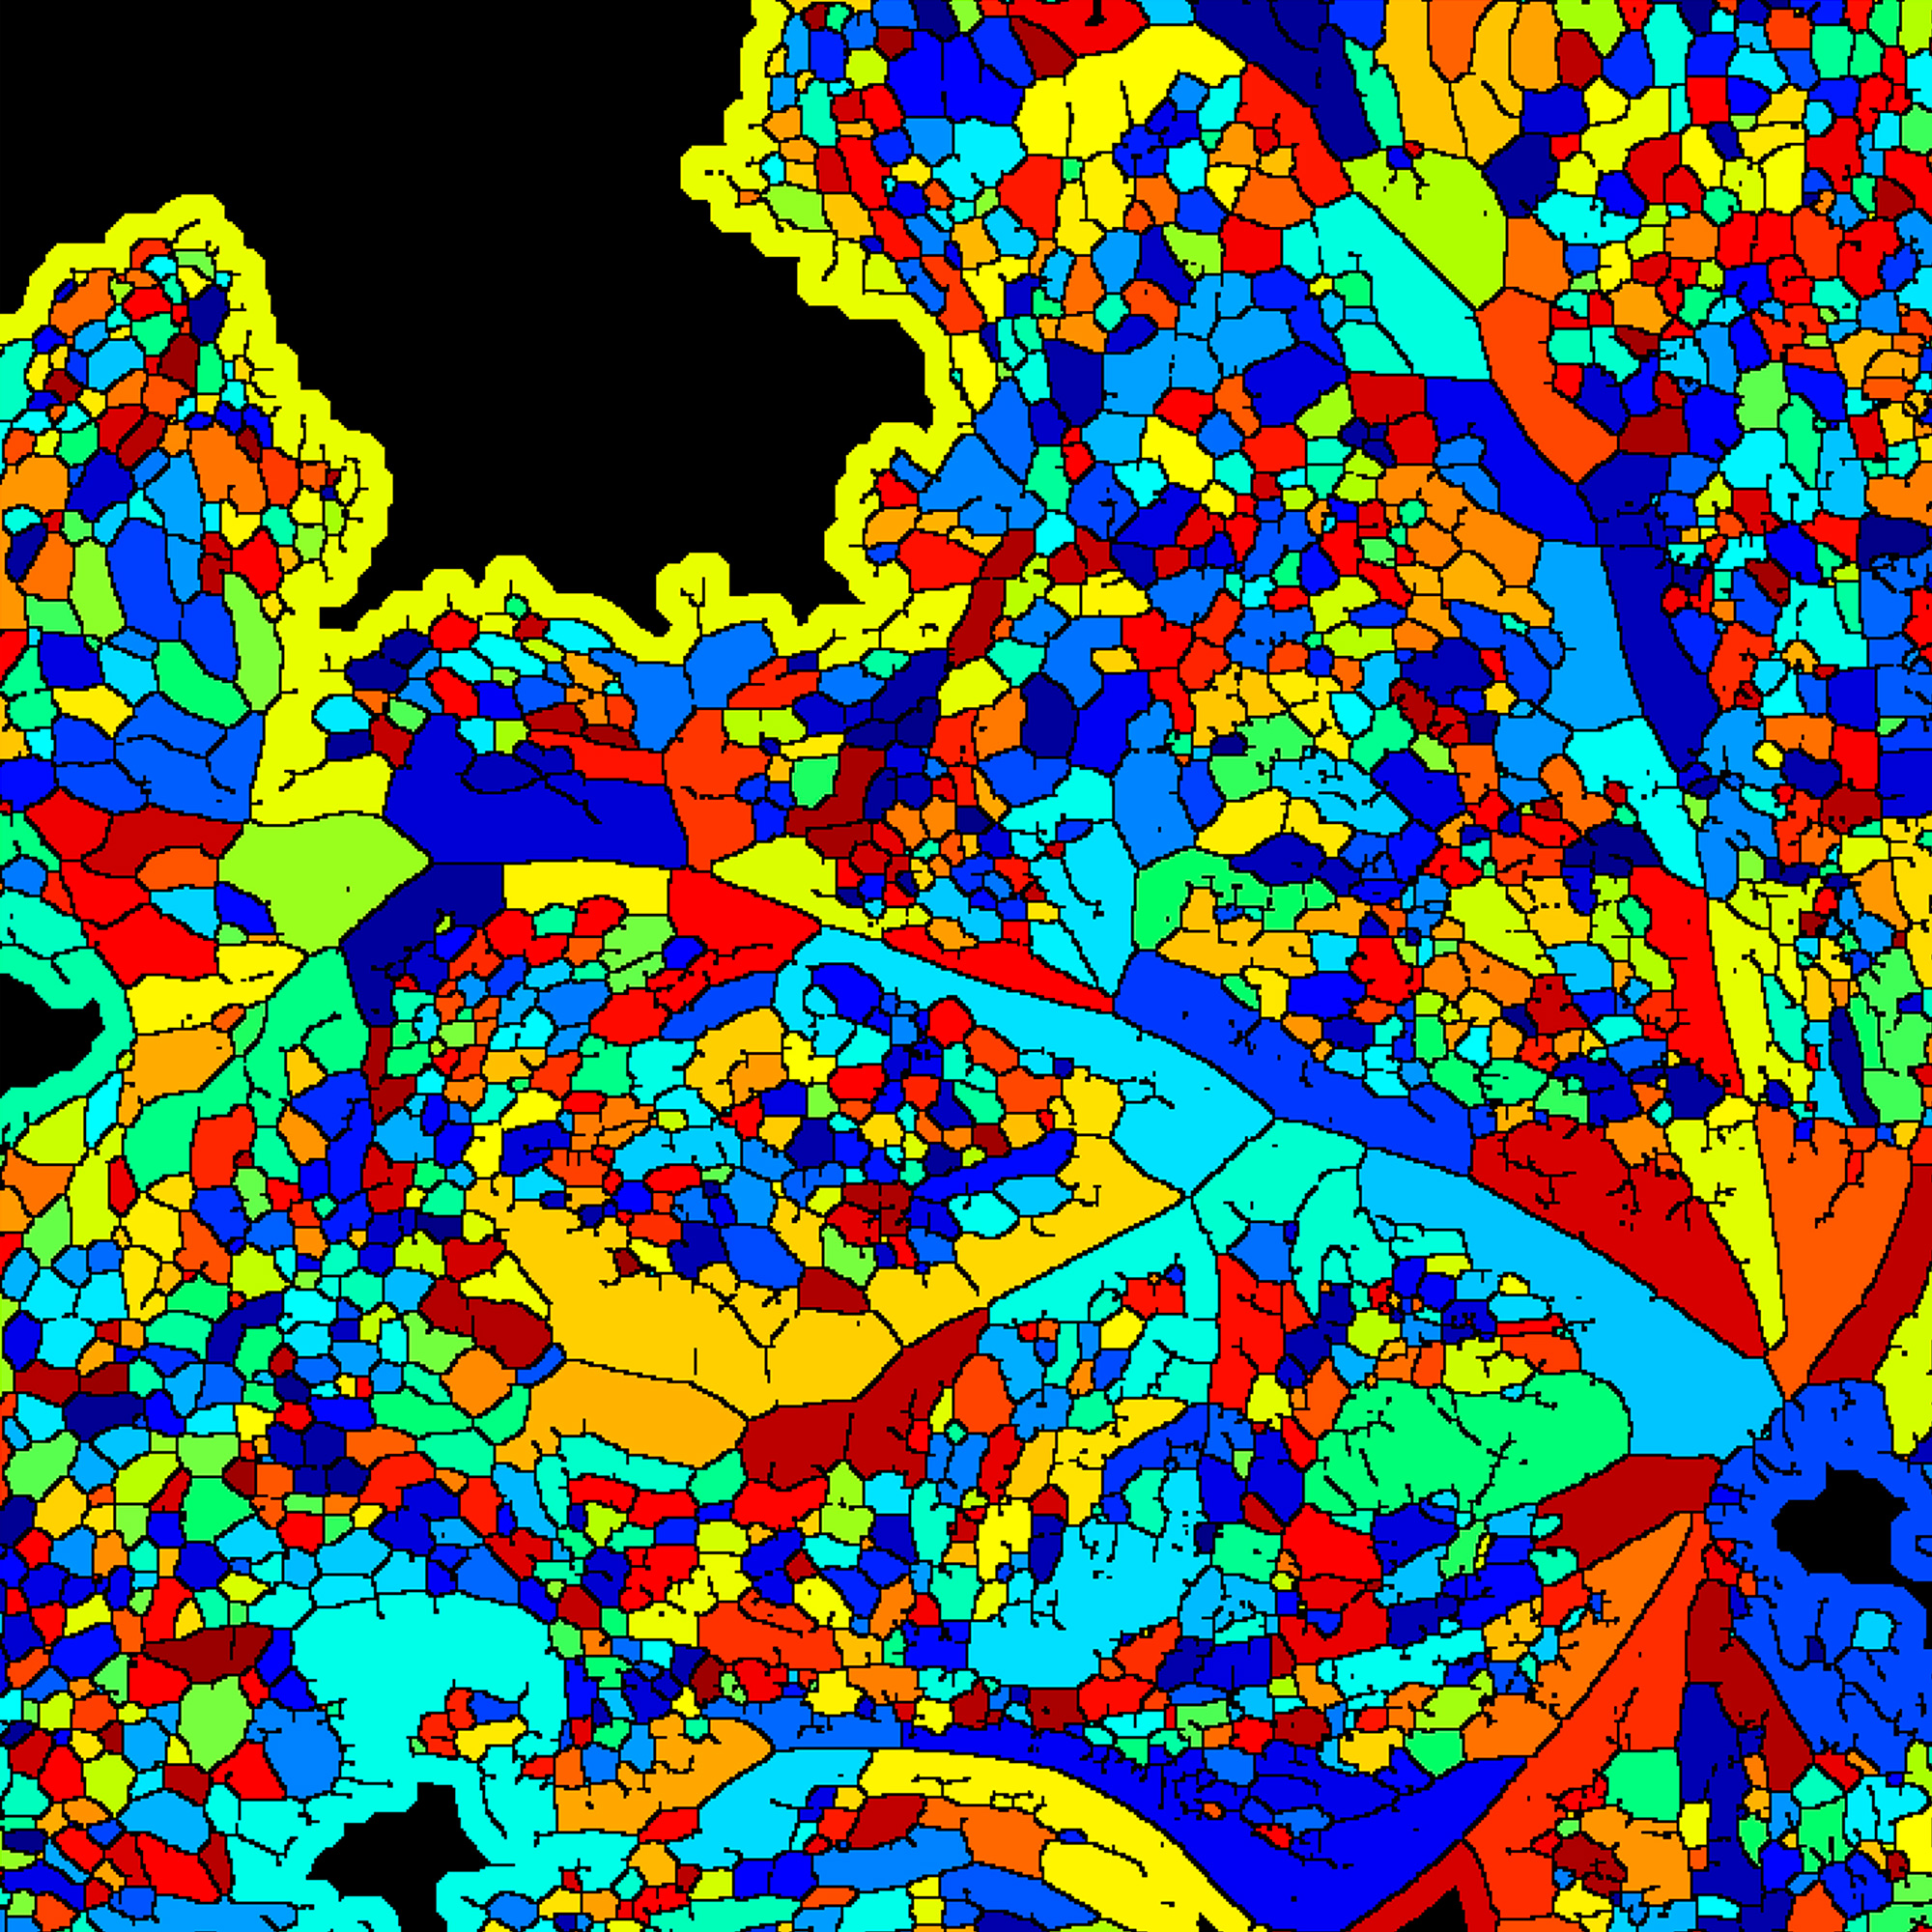
 Areas between vessels in the retina can be used as a descriptor of retinal abnormality. Randomized colours are often used as a quick way to check the accuracy of the segmentation. Credit: Leigh Coultas, Lachlan Whitehead
 -
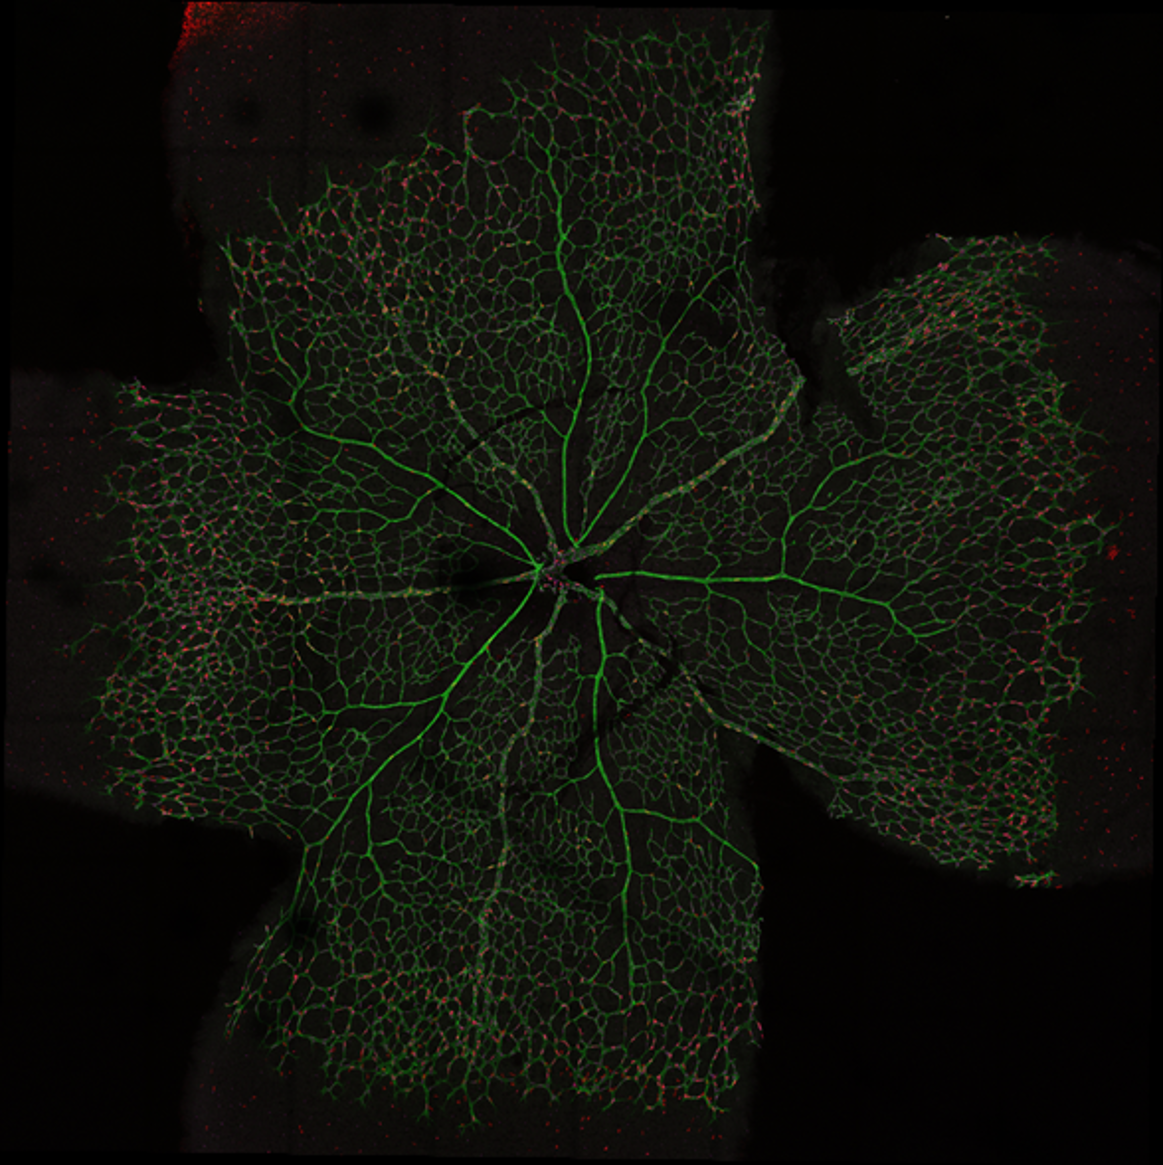
 Imaging of the retinal vasculature is used to study various eye diseases and conditions. Here cells within the minor vasculature are segmented while the main vessels are excluded. Credit: Emma Watson, Leigh Coultas, Lachlan Whitehead
 -
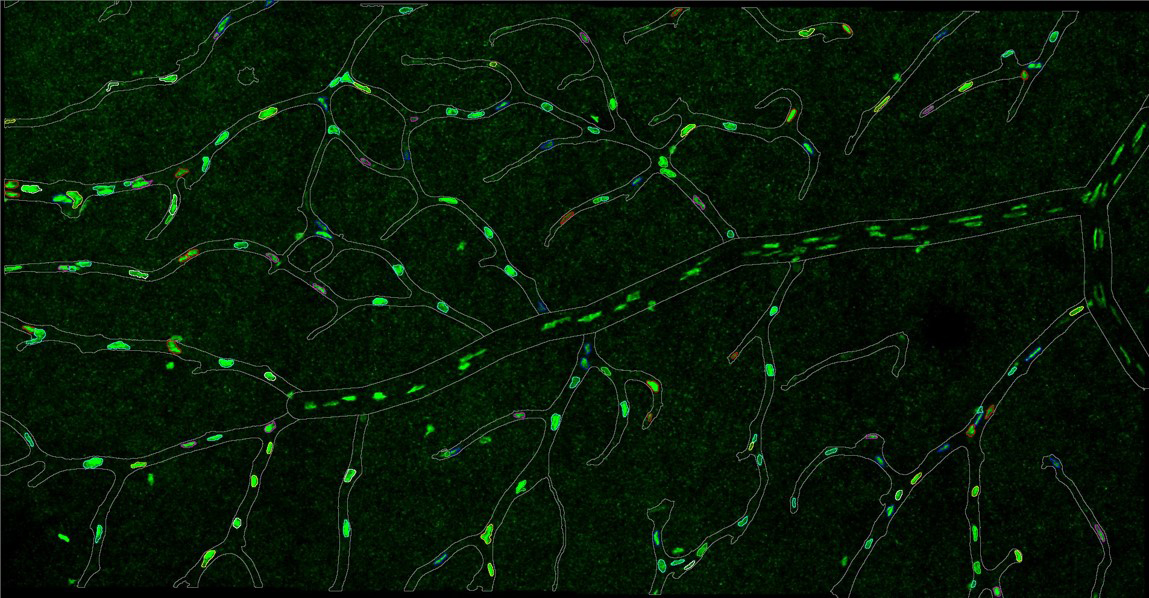
 Imaging of the retinal vasculature is used to study various eye diseases and conditions. Here cells within the minor vasculature are segmented while the main vessels are excluded. Credit: Emma Watson, Leigh Coultas, Lachlan Whitehead
 -
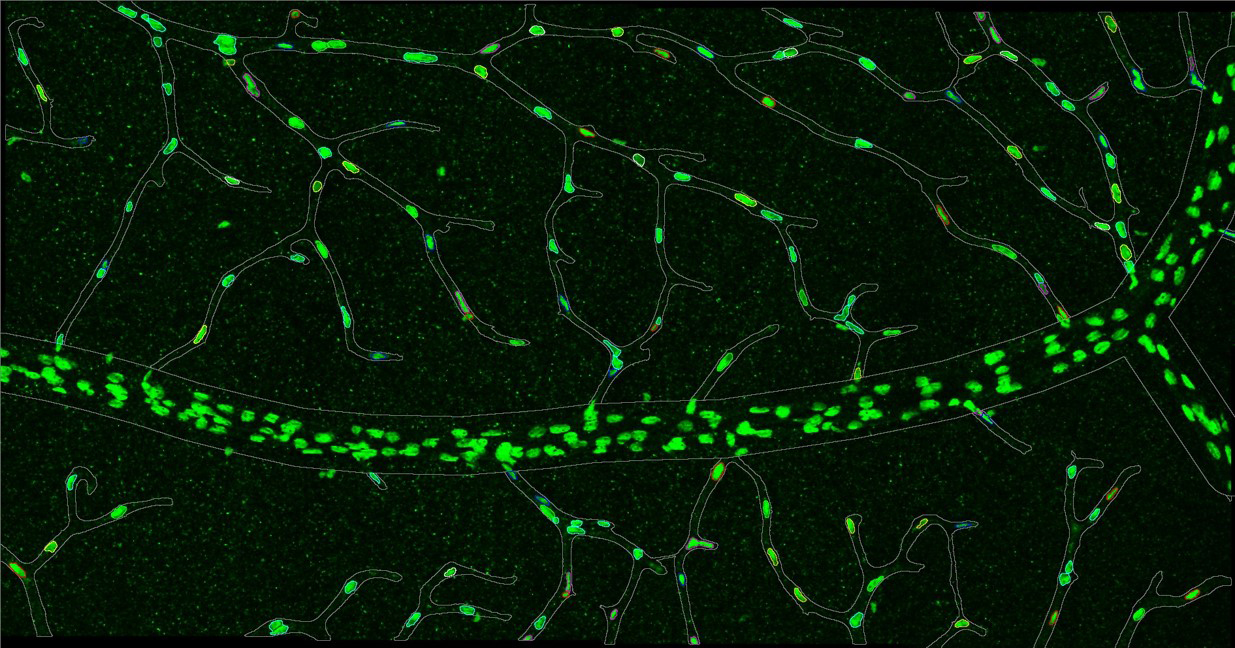
 Imaging of the retinal vasculature is used to study various eye diseases and conditions. Here cells within the minor vasculature are segmented while the main vessels are excluded. Credit: Emma Watson, Leigh Coultas, Lachlan Whitehead
 -
 Imaging of the retinal vasculature is used to study various eye diseases and conditions. Here cells within the minor vasculature are segmented while the main vessels are excluded. Credit: Emma Watson, Leigh Coultas, Lachlan Whitehead
 -
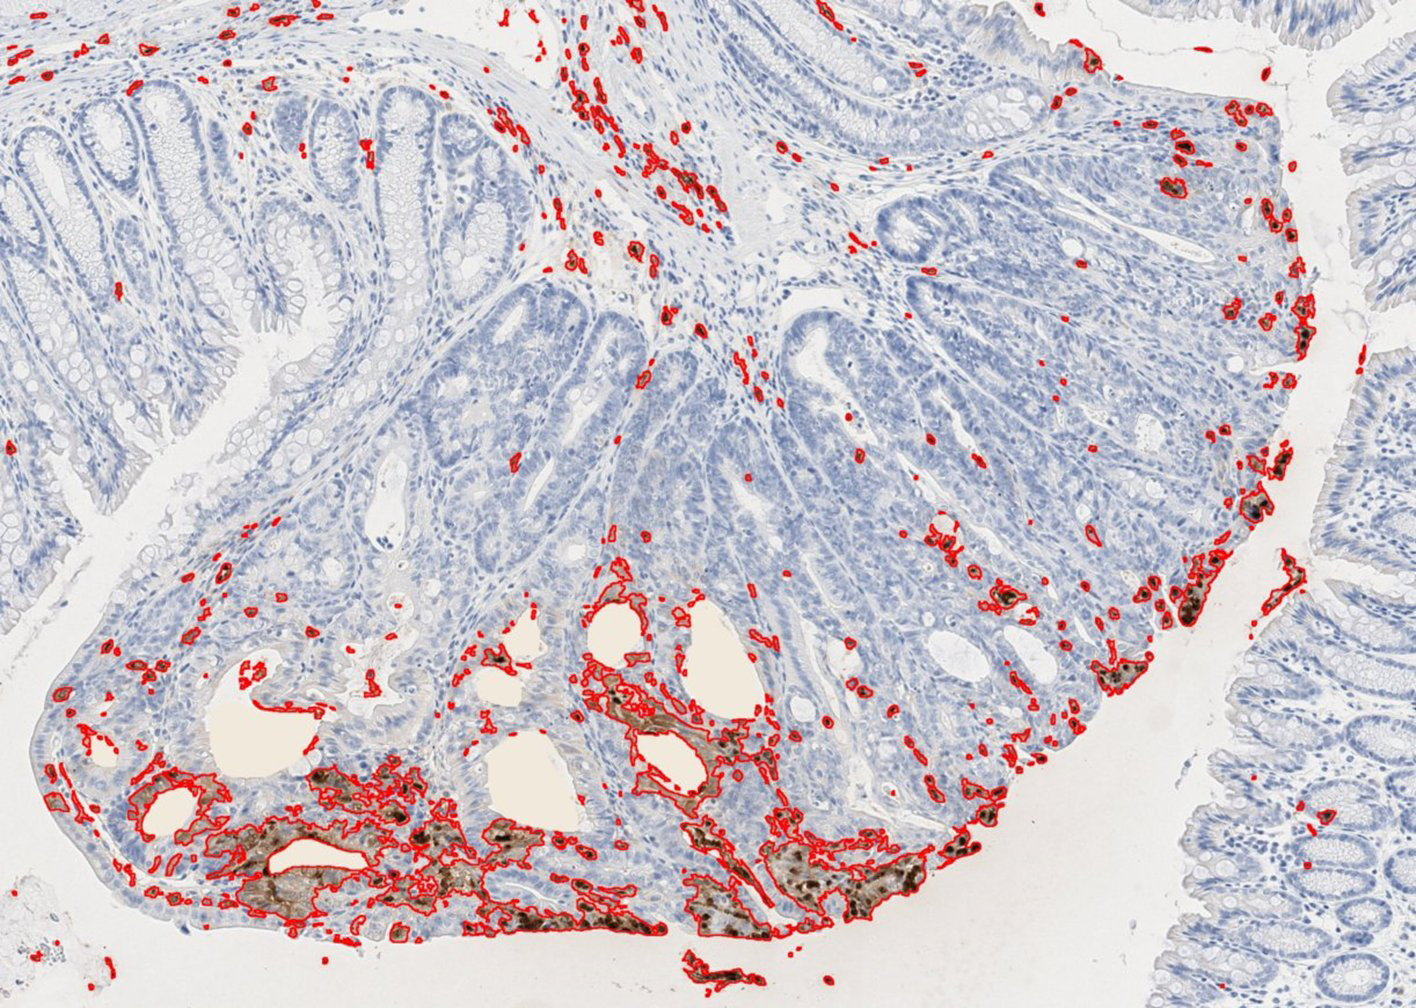
 Slides stained with IHC protocols are routinely scanned and analysed, quantifying the areas and/or cell numbers in the various stains.
 -
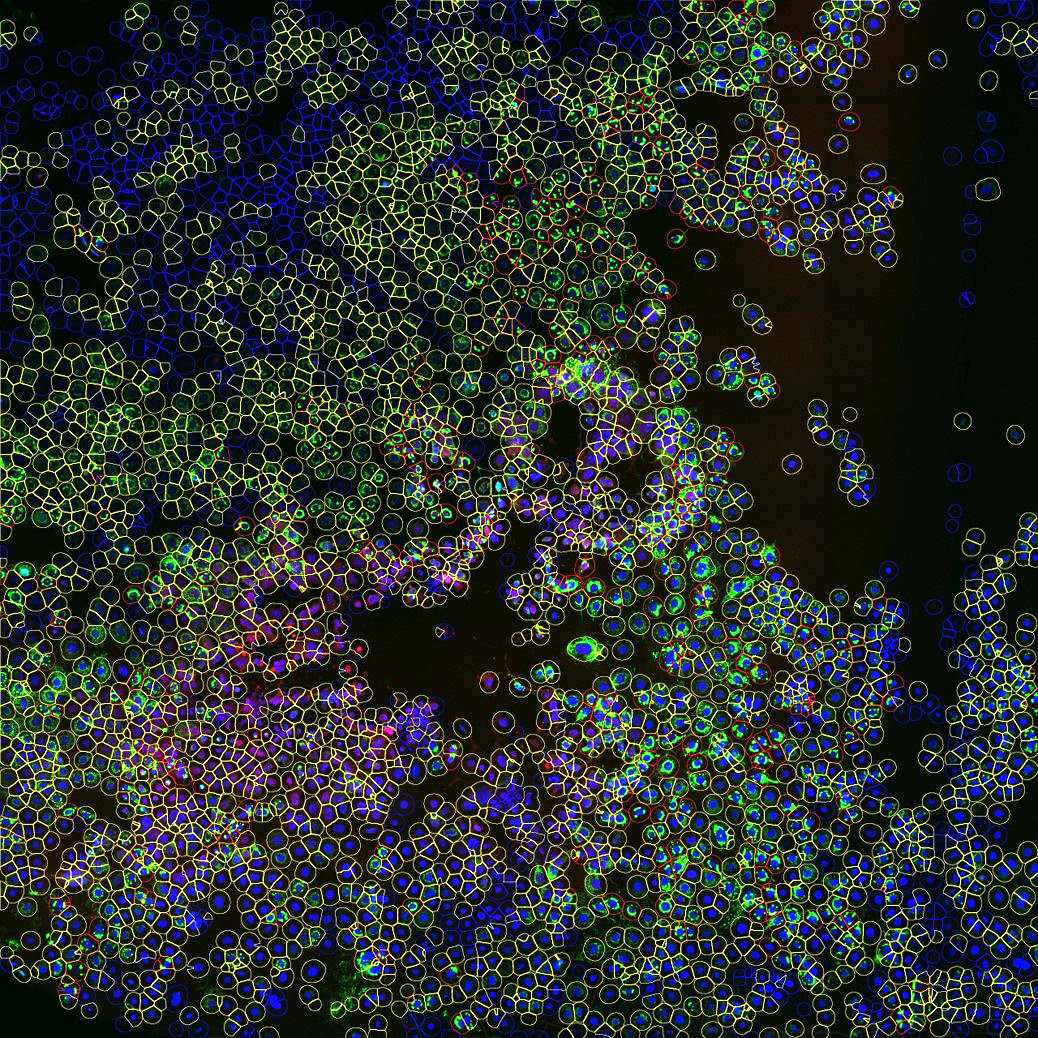
 Cells are imaged in a monolayer with several markers. They are then segmented and classified using a variety of measured properties that can be individually adjusted depending on the cells of interest. Credit: Tan Ngyuen, Ken Pang, Lachlan Whitehead
 -
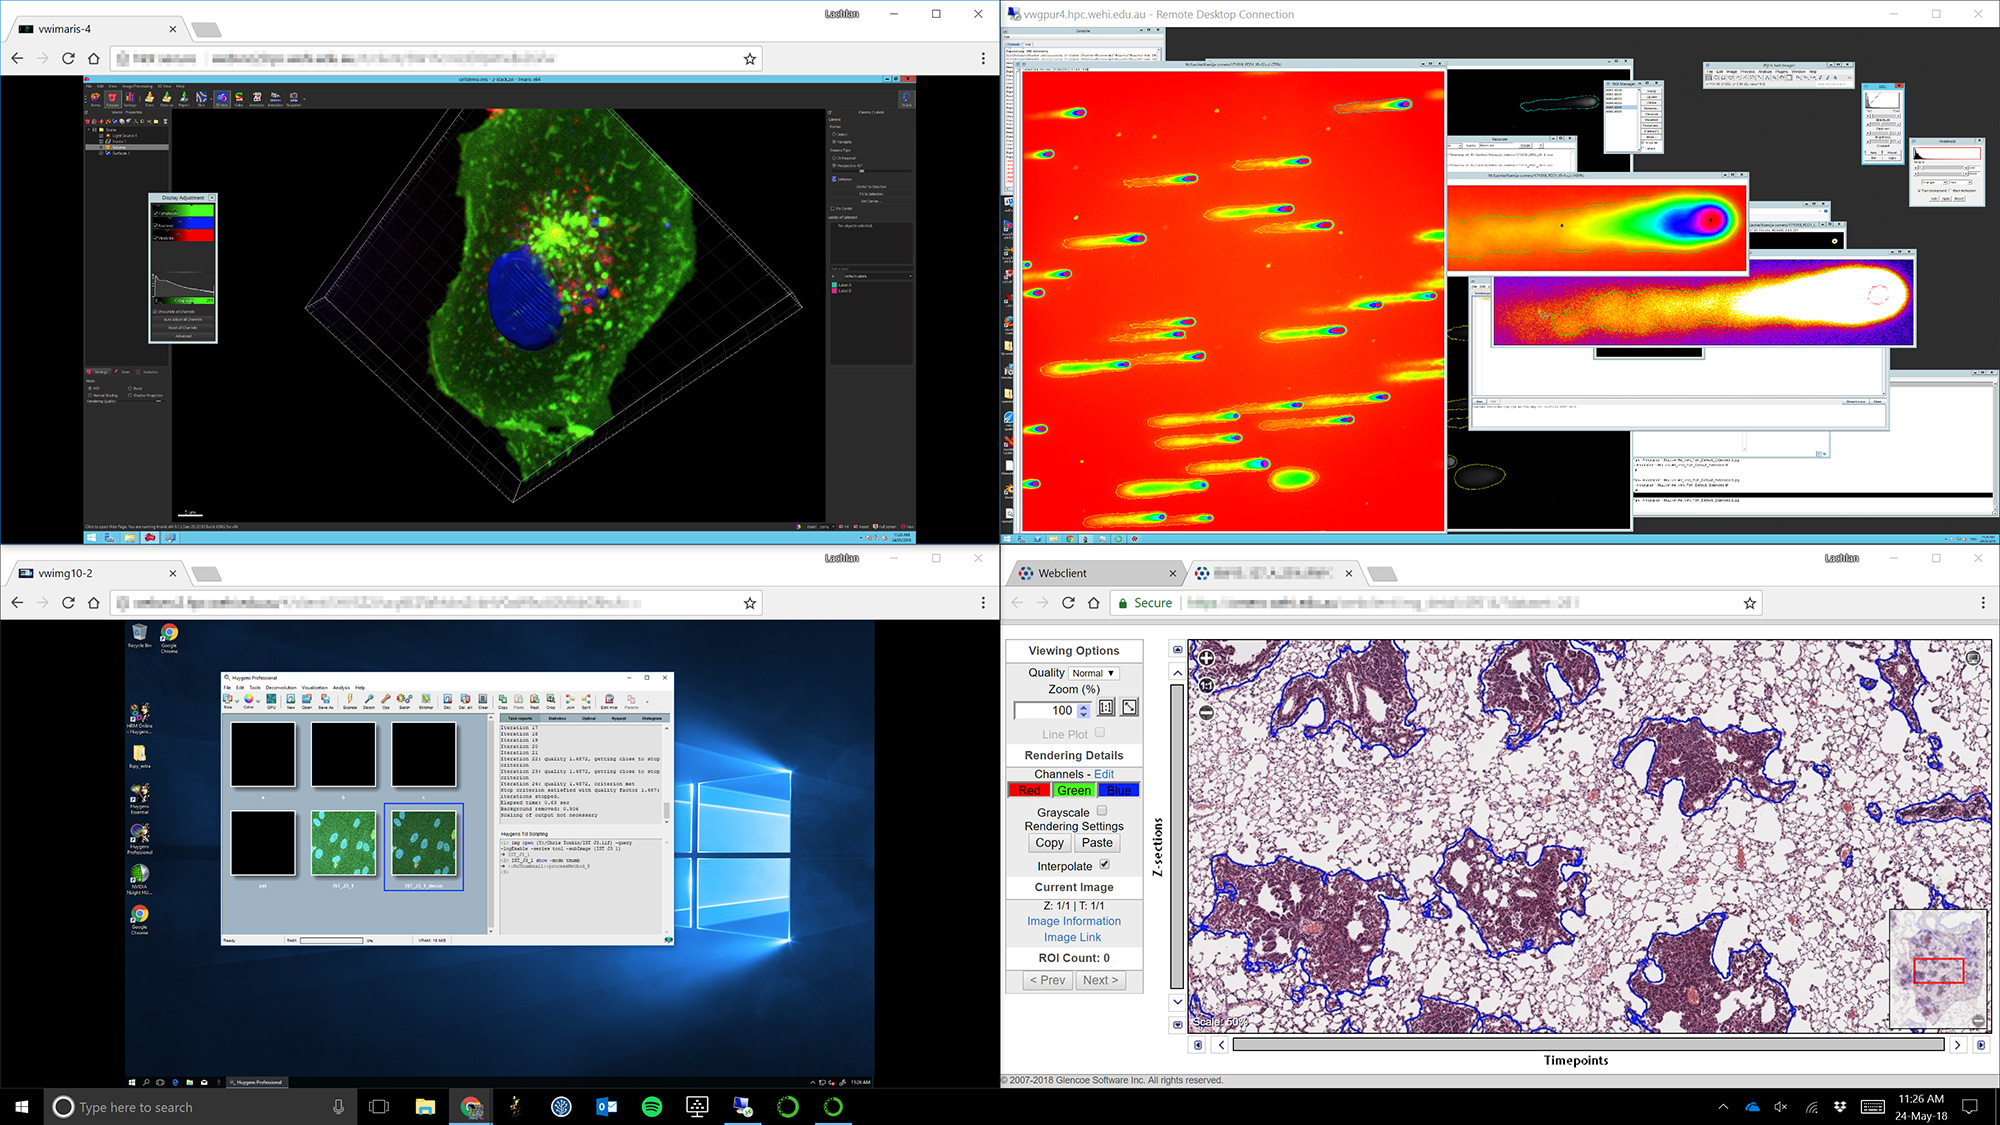
 The centre collaborates with the Institute's e-research team to bring powerful computational resources to researchers. A range of interactive virtual machines are accessible and able to handle the large volume of data being produced with relative ease.
-
Areas between vessels in the retina can be used as a descriptor of retinal abnormality. Randomized colours are often used as a quick way to check the accuracy of the segmentation. Credit: Leigh Coultas, Lachlan Whitehead
-
Imaging of the retinal vasculature is used to study various eye diseases and conditions. Here cells within the minor vasculature are segmented while the main vessels are excluded. Credit: Emma Watson, Leigh Coultas, Lachlan Whitehead
-
Imaging of the retinal vasculature is used to study various eye diseases and conditions. Here cells within the minor vasculature are segmented while the main vessels are excluded. Credit: Emma Watson, Leigh Coultas, Lachlan Whitehead
-
Imaging of the retinal vasculature is used to study various eye diseases and conditions. Here cells within the minor vasculature are segmented while the main vessels are excluded. Credit: Emma Watson, Leigh Coultas, Lachlan Whitehead
-
Imaging of the retinal vasculature is used to study various eye diseases and conditions. Here cells within the minor vasculature are segmented while the main vessels are excluded. Credit: Emma Watson, Leigh Coultas, Lachlan Whitehead
-
Slides stained with IHC protocols are routinely scanned and analysed, quantifying the areas and/or cell numbers in the various stains.
-
Cells are imaged in a monolayer with several markers. They are then segmented and classified using a variety of measured properties that can be individually adjusted depending on the cells of interest. Credit: Tan Ngyuen, Ken Pang, Lachlan Whitehead
-
The centre collaborates with the Institute's e-research team to bring powerful computational resources to researchers. A range of interactive virtual machines are accessible and able to handle the large volume of data being produced with relative ease.
Video: Toxoplasma parasites are imaged live in a dish. When stimulated, around halfway through the timelapse, they become motile. Each parasite is individually segmented and tracked. Credit: Rebecca Stewart, Chris Tonkin, Lachlan Whitehead
Hardware
Previously, access to software was provided by high-end workstations inside the imaging laboratory. Now, users can access software through a range of interactive virtual machines hosted on the Institute’s High Performance Computing Cluster.
These machines allow users to access computing power from anywhere, including high-end graphics processing units (GPUs), large amounts of data storage and fast data transfer to and from network storage.
The virtual machines can be booked like any other instrument.
Software
- Fiji Is Just ImageJ (Fiji) – a widely used, open-source imaging processing package.
- Bitplane Imaris – state of the art software for the visualisation and analysis of three- and four-dimensional data sets.
- Huygens – a powerful suite of tools for the deconvolution and processing of widefield, confocal, two-photon, and light sheet data.
- Arivis – software connected to the Zeiss Lightsheet Z.1 enabling visualisation and analysis of light-sheet data.
- OMERO – open-source software allowing users to view, organise, analyse and share data from anywhere with internet access.
Acknowledgement
Bioimage analysis infrastructure is provided with the generous support of The William Angliss Charitable Trust (Victoria).
Visualisation and analysis software is supported through Perpetual Impact from the following trusts:
- Annie Frida Minna Adams Charitable Trust
- The Derham Green Fund
- The Ann Helene Toakley Charitable Endowment

